Backlink Price Research. Factors and Metrics That Influence Cost.
Analysis of 1.3 million guest posting offers across 14 marketplaces reveals the key metrics and factors that determine backlink pricing.
We analyzed 1,333,242 guest posting offers for 321,962 unique domains from 14 leading marketplaces and 10 major link-building companies.
The average guest posting price across the entire database is $204.88.
But when we dive deeper into this average, we see prices ranging from single digits up to five figures for a single post.
So we decided to research the fundamental factors that influence link-building market prices.
Our goal was to examine how website metrics and audience parameters influence backlink prices across websites and the strength of the correlation.
But let’s look at the “big picture” of guest posting prices first.
Price range distribution
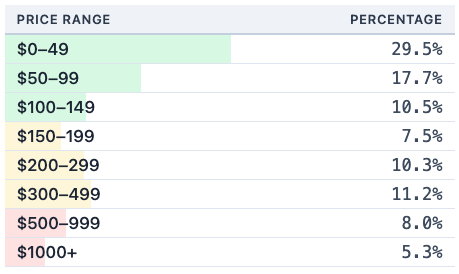
The vast majority of market offers sit in the lower price range. Almost 30% of offers cost $50 or less.
However, it is worth noting that this range comes from the lowest quality publishers, often with very low traffic.
Real demand in developed markets mainly concentrates in the $100 to $300 range. This segment accounts for about 28% of all offers in the database, but more than 80% of actual orders.
The higher price range of $500 and above belongs mainly to digital PR rather than pure link building. These prices usually come from media outlets and often include content creation. It’s roughly 13% of the total inventory.
Which SEO metrics influence backlink pricing the most?
Here’s what we found:
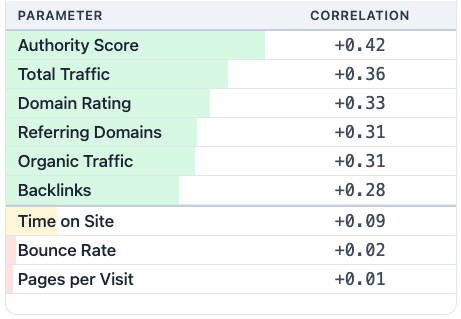
- The strongest correlation is the Semrush Authority Score. I was a big proponent of this metric because it pulls together backlinks, organic traffic, and spam signals. It is good to see solid data supporting it.
Authority Score vs Median Price
There are two notable dips on the graph. AS 71-80 and 91-100 price ranges.
In the 71-80 range, there are tens of subdomains of naszemiasto.pl (AS 77, $69), portfolio pages on behance.net (AS 80, $10), and prezi.com (AS 72, $17), creating many artificially cheap offerings but providing little to no backlink value.
In AS 91+, the trend is influenced by large UGC websites: reddit.com (AS 100, $5), medium.com (AS 98, $5), linkedin.com (AS 100, $16), github.com (AS 100, $7), and canva.com (AS 100, $17). Tons of cheap deals but no actual “link juice”.
The dotted line represents data cleaned from the “noise” publishers and shows a clear correlation.
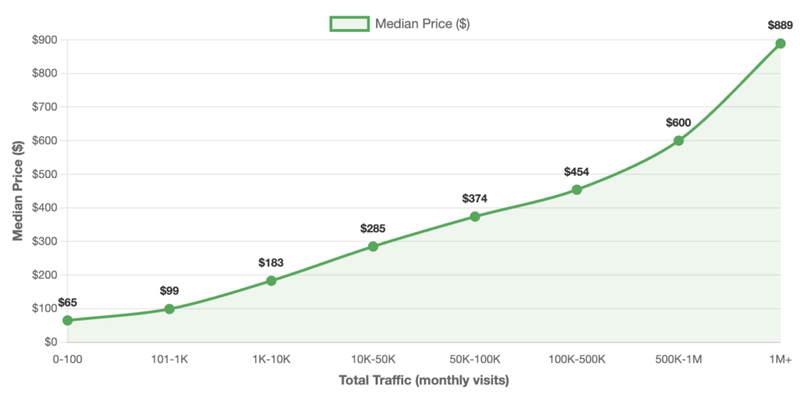
- The second strongest is Total Traffic. That makes sense. Publishers value their sites not only for organic traffic, but for the overall audience they can reach.
- The third metric is DR from Ahrefs. Most link builders still treat Domain Rating as a core benchmark. That pushes publishers to rely on it to justify their prices.
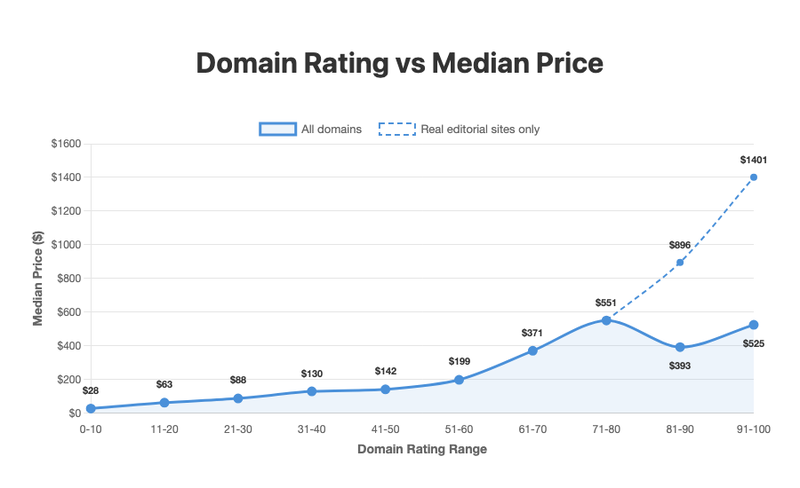
Similar to the Authority Score graph, the dotted line represents data cleaned from UGC platforms and subdomain networks. Sites like Reddit, Medium, LinkedIn, and free blog hosts offer many cheap placements but provide little SEO value.
It is important to note that even the most correlated metrics stay below 0.5. This shows that pricing in this market is still very arbitrary.
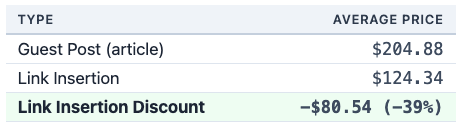
Guest posting vs link insertion
Link insertion, in general, is 39% cheaper than guest posting. The average link insertion price is $124.
It doesn’t mean link insertion is always cheaper. This is how the price difference is distributed:
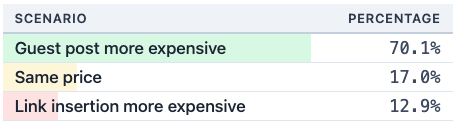
In 17% of cases, prices are the same; in 70%, guest posting is more expensive; and in 13%, link insertion costs more.
Restricted niches pricing (Adult, Casino, CBD, Crypto, Dating, Finance, Medicine).
39.1% of websites in our inventory accept content and links for at least one “restricted” niche, and 7.3% of publishers accept all of them.
Niche % Accepting Avg Price Premium Casino 32.2% $297 +64.0% Crypto 30.9% $269 +44.0% Finance 28.6% $335 +44.1% CBD 26.9% $234 +49.0% Dating 19.0% $314 +49.8% Adult 13.8% $275 +40.2% Medicine 10.2% $150 +15.0% At Least One 39.1% $277 +47.9%
Casinos have the highest available inventory – 32% of publishers accept links to Casinos, and the highest premium relative to the base price is 64%, resulting in an average price of $297.
If you watch the numbers closely, you can see that the prices and premiums in the table seem mismatched. Finance has a lower Premium of 44%, but a higher cost of $335 than Casino links.
Here’s why.
Sites that accept Finance content are already more expensive ($245 avg base vs $195 for Casino). So even though Finance has a higher final price ($335 vs $297), the relative markup is smaller because you’re starting from a higher base.
In other words: Casino buyers pay a bigger percentage markup, but Finance buyers pay a higher total price.
Pricing by country
Overall, our database contains offers for 122 countries.
However, the lack of a high-quality publishers’ inventory created significant noise in the data for underrepresented countries, so I decided to count only offers with an AScore above the minimum reasonable level of 10.
The table below shows the median guest post price across 64 countries, based on a guest posting inventory of at least 100 unique publishers with an Authority Score above 10.
.gp-table { width: 100%; max-width: 500px; margin: 20px auto; border-collapse: collapse; font-family: -apple-system, BlinkMacSystemFont, 'Segoe UI', Roboto, sans-serif; } .gp-table th { background: #f1f5f9; color: #334155; padding: 6px 12px; text-align: left; font-size: 13px; text-transform: uppercase; letter-spacing: 0.05em; font-weight: 600; border-bottom: 2px solid #cbd5e1; cursor: pointer; user-select: none; } .gp-table th:hover { background: #e2e8f0; } .gp-table th::after { content: " ⇅"; opacity: 0.3; font-size: 11px; } .gp-table th.sort-asc::after { content: " ↑"; opacity: 1; } .gp-table th.sort-desc::after { content: " ↓"; opacity: 1; } .gp-table td { padding: 4px 12px; border-bottom: 1px solid #e2e8f0; font-size: 15px; color: #1e293b; } .gp-table .value { font-family: monospace; text-align: right; color: #475569; } .gp-table .rank { font-family: monospace; text-align: center; color: #94a3b8; width: 30px; } .gp-table tbody tr:hover { background: #f0f7ff; } .gp-title { max-width: 500px; margin: 30px auto 0; font-family: -apple-system, BlinkMacSystemFont, 'Segoe UI', Roboto, sans-serif; font-size: 20px; font-weight: 600; color: #1e293b; }
Median Price by Country
# Country Median Inventory 1 🇨🇭 Switzerland $773 293 2 🇦🇹 Austria $755 466 3 🇪🇪 Estonia $661 238 4 🇸🇪 Sweden $623 1,452 5 🇫🇮 Finland $590 641 6 🇩🇪 Germany $546 7,665 7 🇦🇿 Azerbaijan $500 181 8 🇳🇱 Netherlands $494 5,362 9 🇹🇭 Thailand $490 191 10 🇸🇮 Slovenia $467 110 11 🇸🇰 Slovakia $431 432 12 🇧🇪 Belgium $418 509 13 🇯🇵 Japan $408 737 14 🇭🇷 Croatia $378 464 15 🇳🇴 Norway $375 432 16 🇵🇹 Portugal $354 531 17 🇩🇰 Denmark $348 1,597 18 🇦🇺 Australia $347 1,016 19 🇰🇿 Kazakhstan $334 293 20 🇬🇷 Greece $319 726 21 🇮🇹 Italy $315 5,281 22 🇧🇬 Bulgaria $305 716 23 🇪🇸 Spain $305 4,275 24 🇨🇱 Chile $298 454 25 🇨🇴 Colombia $298 438 26 🇮🇪 Ireland $295 131 27 🇳🇬 Nigeria $283 543 28 🇲🇽 Mexico $282 2,225 29 🇨🇿 Czechia $277 1,052 30 🇱🇻 Latvia $277 200 31 🇵🇪 Peru $270 299 32 🇦🇷 Argentina $267 1,116 33 🇬🇧 United Kingdom $266 3,932 34 🇻🇪 Venezuela $262 178 35 🇬🇪 Georgia $259 105 36 🇸🇦 Saudi Arabia $252 273 37 🇭🇺 Hungary $251 1,177 38 🇿🇦 South Africa $244 395 39 🇳🇿 New Zealand $242 100 40 🇱🇹 Lithuania $239 380 41 🇧🇦 Bosnia $230 125 42 🇸🇬 Singapore $228 213 43 🇧🇷 Brazil $211 4,489 44 🇫🇷 France $208 13,115 45 🇺🇸 United States $206 17,798 46 🇷🇸 Serbia $202 224 47 🇵🇱 Poland $199 8,751 48 🇪🇬 Egypt $193 436 49 🇻🇳 Vietnam $190 459 50 🇭🇰 Hong Kong $182 178 51 🇵🇭 Philippines $182 765 52 🇷🇴 Romania $173 1,621 53 🇦🇪 UAE $163 331 54 🇨🇦 Canada $163 1,341 55 🇮🇳 India $158 6,832 56 🇹🇼 Taiwan $158 273 57 🇲🇾 Malaysia $150 274 58 🇹🇷 Turkey $150 1,925 59 🇮🇩 Indonesia $136 2,718 60 🇵🇰 Pakistan $109 365 61 🇲🇦 Morocco $108 118 62 🇧🇩 Bangladesh $104 130 63 🇺🇦 Ukraine $61 3,372 64 🇷🇺 Russia $40 3,723
Max Roslyakov
Founder, FatGrid